Visualize Potential-Based Center of Gravity (COG) and Potential Field
Source:R/draw_potential.r
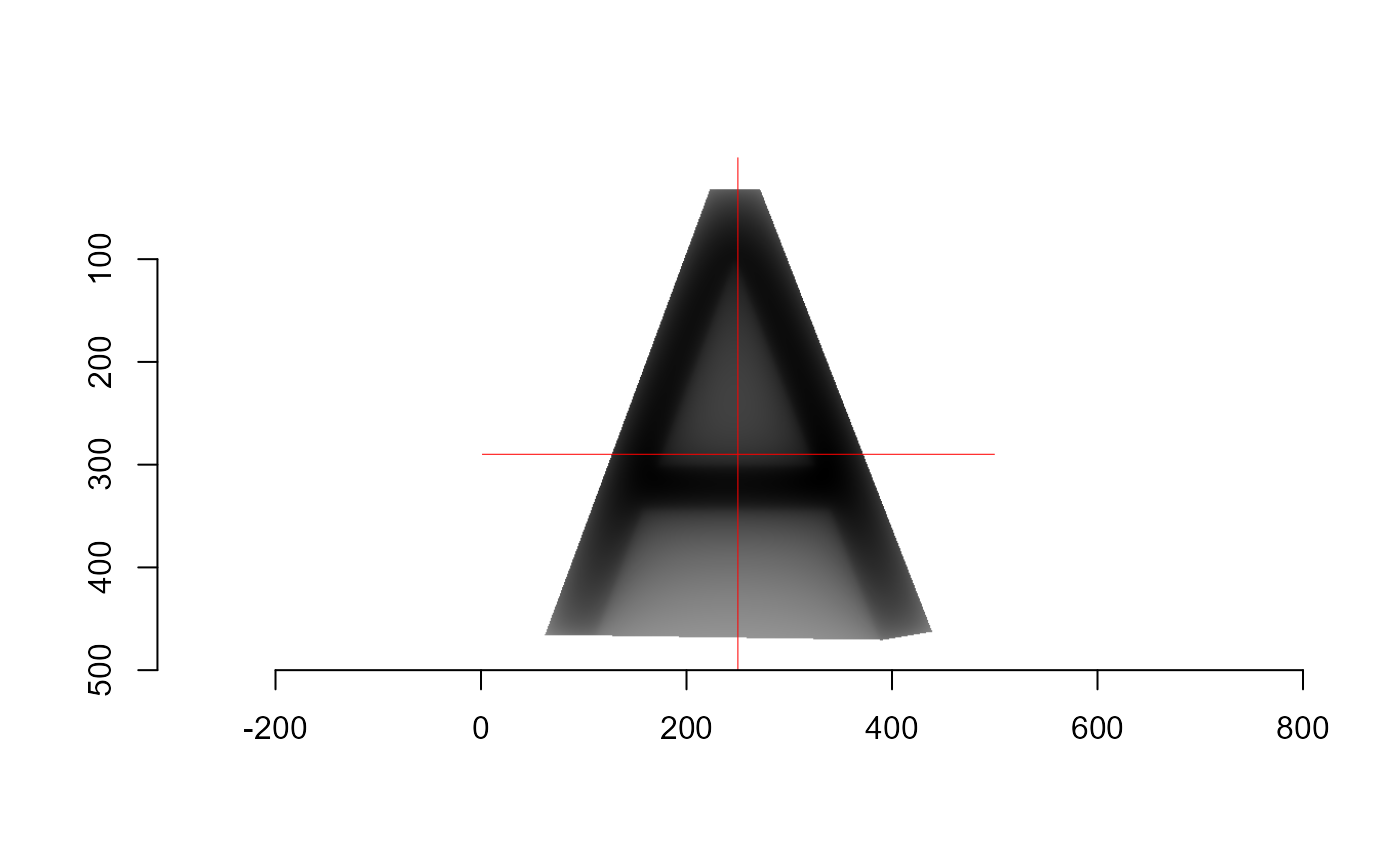
draw_potential.RdVisualizes the normalized potential field and center of gravity (COG) computed by
cog_potential. Each pixel's potential is shown as grayscale intensity,
where darker pixels indicate higher potential. Optionally overlays crosshair lines
at the computed COG to indicate its position.
Arguments
- lst
A list returned by
cog_potential, containing a data frame of normalized potentials and computed statistics.- show_cog
Logical. If
TRUE(default), draws horizontal and vertical red lines through the COG.- plot_image
Logical. If
TRUE(default), plots the generated image. IfFALSE, returns the image object without displaying it.- cimg
Logical. If
TRUE(default) and imager is available, returns acimgobject. IfFALSE, always returns a raster object.
Value
If cimg = TRUE and imager is installed, returns a cimg
object. Otherwise, returns a raster object (class "raster").
Details
By default (cimg = TRUE), the function returns a cimg object if the
imager package is available. If imager is not installed or if
cimg = FALSE, a base R raster object created by as.raster() is returned.
Examples
# \donttest{
  data(img_A)
  result <- cog_potential(img_A)
  draw_potential(result, show_cog = TRUE, cimg = FALSE)

# }
# }